The mystical art of setting competitive rents has just been made a lot easier with new data about private lettings across England going online.
The government’s Valuation Office Agency (VOA) – the people who value property and other assets for Council Tax and other taxes – have compiled rent maps of several regions in England.
The data is a comprehensive look at different types of properties and the rents charged over recent months.
The figures give some revealing insights in to private renting in England.
The information is available as Excel spreadsheets or colour coded maps for one, two and three bed properties.
The Excel spreadsheet also includes data for rented rooms in houses in multiple occupation (HMO).
HMO rent breakdown
According to the figures, England has 45,128 individual letting rooms rented by single tenants at an average rent of £348 per month, although the lowest renters pay £256 in the North East but those in London pay £500 a month.
The table also shows London has the most letting rooms (7,000), followed by the South West (6,730) and the North West (6,703). The fewest are in the North East (1,966).
The VOA promises the data release is the first of regular updates and that the service will expand.
“The statistics are based on around 500,000 achieved private rents within a 12 month period. They include new lettings, those where the tenancy rolls over (periodic tenancies), and renewals where a new contract is agreed with the existing tenant. They representative a simple view of prevailing gross market rents,” said a spokesman.
To access the maps and statistics, go to the VOA web site
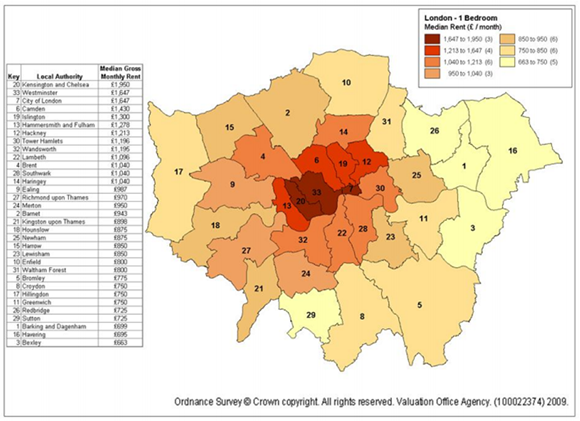
Here’s a sample map showing average rents for a one-bedroomed rental property in London: